Pathian®
Analytics
Pathian® Analytics use mathematical modeling to determine how your commercial building’s HVAC system should be operating at all outdoor air temperatures. This best case model is then compared to how your building is actually operating. We then present this information in the form of Pathian Actionable Insights and Pathian Curves.
How it works
Pathian makes it easy to use its cloud-hosted analytics. All you need to do is install the Pathian appliance for Niagara, connect to the Pathian cloud, and use the automated engineering to guide you the rest of the configuration.
Pathian Analytics Cloud
Pathian analytic data and Pathian Curves are displayed right within your customer’s building automation system. This gives a unified user experience and empowers the customer to consume the AOS analytic results in their own reports, dashboards, and graphics. The Pathian Niagara driver exposes Pathian analytic points from within the Niagara Framework®. From there the points can be mapped into the customers Building Automation System.
Approved Funding!
The Pathian AOS Analytics give you detailed potential energy savings to help you get funding approved for upgrade and service projects for your airside systems. This combined with the occupant space compliance and building envelope health scoring will you achieve LEED Energy Conservation and Indoor Environmental Quality certification. The energy savings and utility rebates pave the way for 1 to 4 year paybacks on most airside optimization projects.
What you can do
Pathian has an entire suite of analytics. Pick what you need, when you need it. Analytic points and features can be added any time from within your own building automation system. No tools required.
Actionable Insights
We give your site a voice to inform you if occupants are at risk of airborne infectious disease, how many energy dollars are being wasted due to HVAC system inefficiencies, and most importantly what to do about it. Using our Health Scoring system, you will see at a glance:
- Occupant Space IAQ Compliance
- Building Envelope Health Level
- Mechanical Equipment Performance Ratings
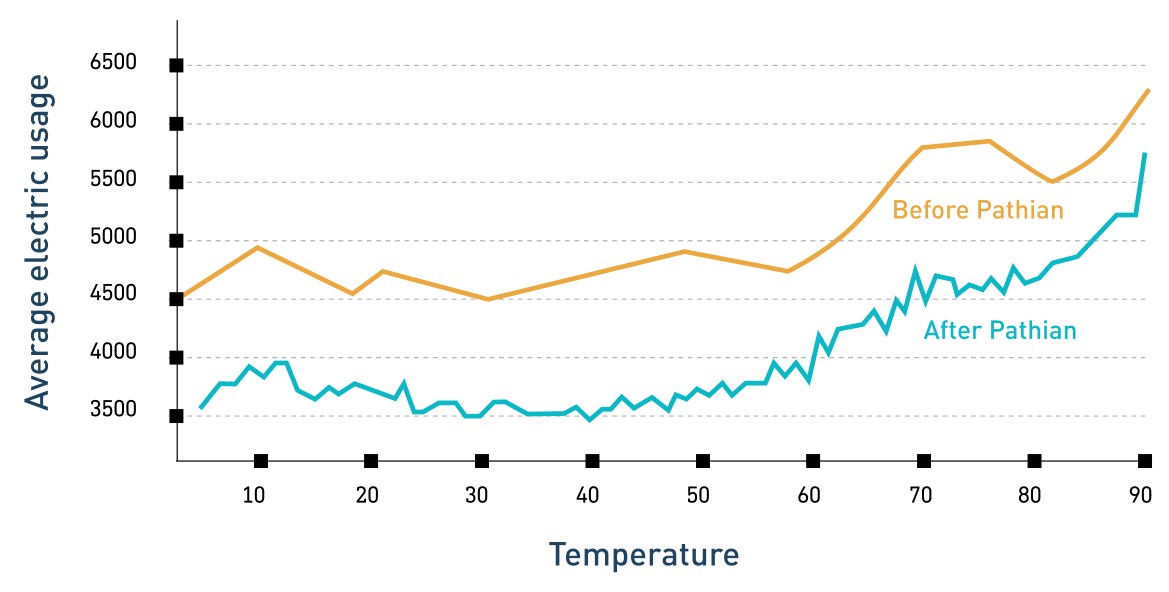
Pathian Curves:
The picture of performance
Our exclusive weather-normalized benchmarking process gives you a perfect picture of how your entire HVAC system is currently operating. It pinpoints where your energy deficiencies lie with unprecedented clarity, allowing you to maximize energy efficiency.
Weather indifference is our difference
Indifferent to time period, weather and location, our Pathian Curves and Analytics eliminate weather normalization and help you understand how your system can better respond to environmental changes.
A curve above the rest
- Pathian Curves are 10x more accurate than our competitors because our energy curves are generated without making a single assumption.
- Pathian Curves are the only metrics indifferent to time period, weather and location.
Benchmarking products
With 64,000 performance indices, our process
includes 11+ performance analyses.
- Group benchmarking™
- Peer benchmarking™
- Status benchmarking™
- Control sequence benchmarking™
- Load-to-position benchmarking™
- Position benchmarking™
Compare and save
Using data from your building management control system and our proprietary, patented technology, we’ll create a Pathian Performance Index™ for each energy point and control sequence and do comparative analysis to determine potential energy and cost savings.